Modularising the e-Framework
Introducing SUM Composition Diagrams
In our continuing quest to help identify common services for generic infrastructure, we present a modular extension to the e-Framework. In the e-Framework, a Service Usage Model (SUM) usually represents an orchestration of services to support a few closely related business processes in a particular context. We are instead developing SUMs that group generic functionality useful in a wide range of contexts. To make this work, we need a notation more precise than standard SUM diagrams: SUM Composition Diagrams. Details below the fold.
Why SCDs help
Consider the following SUM diagram:
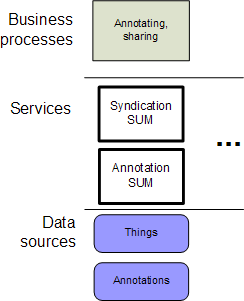
This tells us that:
- There is syndication
- There are annotations
But what is being syndicated, exactly? Things? Annotations? Both? We’ll answer this question at the end.
Frequently, the answers to these questions are clear from context, or are readily explained in the surrounding discussion. But at times it is helpful to be more precise and to map out exactly what we mean: exactly what data sources are shared between SUMs, how many instances of a particular service might be required, and so forth.
A SUM integration diagram is thus a useful tool for discussion during the planning process of a new system, during implementation, and afterwards. It shows:
- What services are required to support each piece of functionality.
- What kinds of data must be managed and accessible by groups of services.
- Where efficiency gains could be made by using one software component in several places.
How to use them
First, note the difference between a SUM diagram and a SUM Composition Diagram:
- Each column of a SUM diagram maps one business process onto one or more orchestrated services and data sources, but does not explicitly describe exposed services, or show the relationship between orchestrated services and data sources.
- A SUM Composition diagram maps one or more exposed services onto one or more orchestrated services and data sources. It does not show business processes, nor explicitly show which orchestrated services supported each exposed service. Exposed services are often closely aligned with business processes, but are not synonymous.
How to draw a SUM Composition Diagram
- UML Component Diagram notation is used. A SUM is represented as a Component. Name the component “X” rather than “X SUM”.
- The exposed services of the SUM are represented as interfaces (balls on sticks) on the upper side.
- Services orchestrated by the SUM are represented as sockets on the lower side, or on the left or right. They are labelled with the name of the Service Genre.
- Each data source used by the SUM is shown at the bottom, connected by a dependency arrow.
- If a service orchestrated by the SUM is being provided by another SUM, this can be shown by connecting the exposed service (represented as an interface) of the other SUM to the socket of this one.
- If exposed or orchestrated services in a SUM are optional, mark them with a question mark. Optional services may be omitted altogether in an embedding SUM.

Four exposed services of the Collection Maintenance SUM are consumed as services by the Searchable Collection SUM; this is shown as a dependency arrow.
How to embed one SUM in another
When two SUMs are connected, two processes of joining take place:
- Loose ends can be connected: services exposed by one SUM can be consumed as services by the other
- Common features (data sources, SUMs or individual services) may be matched, or they may be left distinct, with different meanings in each case.
Connecting loose ends
An exposed service can be consumed as a service by another SUM, effectively becoming an ad hoc service genre.
- One exposed service can be consumed by multiple SUMs.
- Not all exposed services of a SUM need be consumed at all. Unused services may be omitted.
- If system functions are to be exposed by the embedding SUM, this should be modelled explicitly in the diagram.
- Caution should be used when making and interpreting these links: the internal workings of systems should not generally be specified. Also, interoperability at genre level does not really exist, so no linkage can be guaranteed to actually work as described. The links should thus be interpreted as “a possibly synergy between two SUMs”.
Levels of detail
Two slightly different kinds of SUM Composition Diagrams are useful:
- When describing a SUM which is likely to be embedded within others, more detail can be added:
- An exposed service that maps directly onto an orchestrated service with little additional functionality can be shown with a “realises” arrow.
- An orchestrated service that is bound to a data source (or more than one) can show that relationship with a dependency arrow.
- When describing a SUM consisting primarily of embedded SUMs, we recommend reducing the amount of detail:
- Do not use the additional detail described above.
- Less significant parts of embedded SUMs should be shrunk or even omitted. For example, consider the case of SUM A which contains SUM B, which contains SUM C which uses data source A, which is not used by any other SUM. The SUM composition diagram for SUM A should
- Show SUM B at normal size
- Show SUM C at reduced size
- Show data source A at reduced size or omit it altogether.
- If multiple services from one SUM are consumed by another, a single dependency arrow between the SUMs can be used, rather than showing all the connections explicitly.
Further guidance on the trade-off between readability and comprehensiveness will be developed over time.
So, what’s being syndicated?
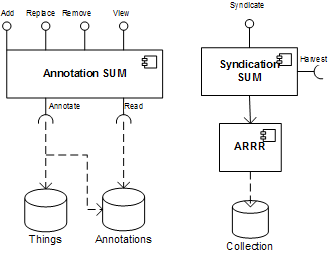
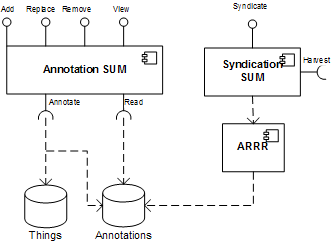
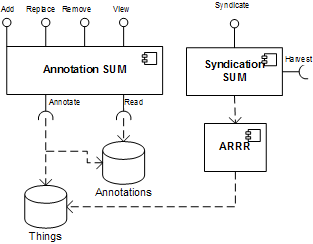
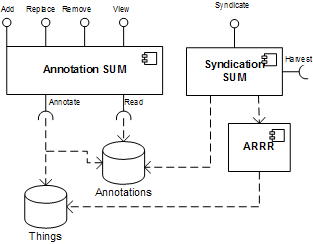
To answer the question from the beginning, we can use SUM Composition Diagrams to be a bit more precise about what that SUM diagram means:
Possibility 1: There are annotations on things, but what’s syndicated is totally separate.
Possibility 2: There are annotations on things, and those annotations are syndicated.
Possibility 3: The things are syndicated, but not the annotations.
Possibility 4: The things and their annotations are both syndicated.



Leave a comment